| | SINTAX, SINTASSI | | | Usage Note, NOTA D'USO | Version 2.1 and later | Examples |
| set cterp | on|off | Turns spline smoothing on or off. Abilita (on) e disabilta (off) la spline smoothing. | "Sticks" until reset. Shaded contours are drawn without spline fitting, so to insure an exact match when overlaying contour lines and shaded contours of the same field, specify cterp as off. You can still use the csmooth option, which affects both contour lines and shaded contours. | | | |
| set frame | on|off|circle | | on plots a rectangular frame around the clipped regionoff plots no frame
circle plots a rectangular frame for lat-lon projections, plots a circular frame for a polar plot at the outermost latitude. Used for whole-hemisphere plots only.
| | | |
| set grid | status <style <color>> (GrADS version 2.0* and earlier)
set grid status <style <color <thickness>>> (GrADS version 2.1* and later)
| This command specifies the characteristics of the displayed grid lines. | Valid options for status are: on - both latitude and longitude lines are drawnoff - no grid lines lines are drawnhorizontal - only latitude grid lines are drawnvertical - only longigude grid lines are drawn
Options for style are: 1 - solid
2 - long dash
3 - short dash
4 - long dash, short dash
5 - dotted
6 - dot dash
7 - dot dot dash
The color argument may be one of the 16 GrADS default colors or a new color defined with set rgb. | The default behavior is to draw horizontal and vertical grid lines with color number 15 (grey) and line style 5 (dotted). Changes to the grid display characteristics 'stick' until reset by a new execution of set grid, or when a reset or reinit command is issued. You cannot specify a color without also specifying a style. Similarly, you cannot specify a thickness without a style and color. Grid lines are aligned with the labeled tick marks on the X and Y axes. GrADS chooses appropriate defaults for spacing of the labeled tick marks, but these defaults may be overridden by the commands set xaxis, set yaxis, set xlint, set ylint, set xlevs, and set ylevs. Please consult these reference pages for more information. The default line widths for thickness settings between 1 and 12 are: 0.6, 0.8, 1.0, 1.25, 1.5, 1.75, 2.0, 2.2, 2.4, 2.6, 2.8, 3.0. The units will depend on the surface being drawn to (pixels or points). | The thickness option was added in version 2.1. It controls the thickness of the gridlines, and must be an integer in the range of 1 to 256. When using GrADS version 2.1 and later, and if your build has the Cairo graphics library enabled, then each thickness setting will increment the grid line thickness. This is different from the behavior in earlier versions, where the grid line thickness setting was fixed at 1. The default grid line thickness setting in version 2.1+ is 4. In GrADS version 2.1 and later, there is a new command, set lwid, that allows the user to define a new line thickness setting if the 12 default widths are unsatisfactory. | set grid on 3 1 2 on - both latitude and longitude lines are drawn3 - short dash - color 1
- thickness 2
|
| set mpdset | <lowres|mres|hires|nmap> | | - lowres is the default.
- mres and hires have state and country outlines.
- nmap covers only North America.
Settings stay the same until changed by new set commands. | | | |
set mproj
| proj | Sets current map projection. | Options for proj are:- latlon Lat/lon projection with aspect ratio maintained (default)
- scaled Lat/lon aspect ratio is not maintained; plot fills entire plotting area
- nps North polar stereographic
- sps South polar stereographic
- lambert Lambert conformal conic projection
- mollweide Mollweide projection
- orthogr Orthographic projection
- robinson Robinson projection, requires set lon -180 180, set lat -90 90
- off No map is drawn; axis labels are not interpreted as lat/lon
| | | |
| set mpt | type offtype color <style <thickness>>
| This command to refine the appearance of the map lines. | The type is the map type; it can be a number from 0 to 255, or it can be an asterick(*) to indicate this command applies to all the type values. The color argument may be one of the 16 GrADS default colors, a new color defined with set rgb, or it can be set to -1, in which case GrADS will use the set map settings for this map type. Options for style are:
1 - solid
2 - long dash
3 - short dash
4 - long dash, short dash
5 - dotted
6 - dot dash
7 - dot dot dash The thickness option must be an integer in the range of 1 to 12 (or 256 for version 2.1 and later.) | The lowres map data set has only one option for type: For the mres and hires data sets, there are three options for type: - 0 -- coastlines
- 1 -- political boundaries (sorry, in some places these are out of date)
- 2 -- US state boundaries
Other map files may have more type options.
Changes to the map characteristics 'stick' until reset by a new execution of set mpt, or when a reset or reinit command is issued.
When using GrADS version 2.0.2 and earlier, for the X window display and the image output (e.g. PNG), a thickness setting between 1 and 5 will result in map lines approximately one pixel wide; a thickness between 6 and 11 will result in map lines two pixels wide, and a thickness of 12 will give map lines approximately three pixels wide. For the vector graphics output (e.g. PostScript and Encapsulated PostScript) the map line thickness will increase with each increment in the thickness value. | If using GrADS version 2.1 and later with the Cairo graphics library enabled, then each thickness setting will increment the map line thickness, for the X window display and all hardcopy output formats.
The default line widths for thickness settings between 1 and 12 are: 0.6, 0.8, 1.0, 1.25, 1.5, 1.75, 2.0, 2.2, 2.4, 2.6, 2.8, 3.0. The units (pixels or points) will depend on the surface being drawn to. In GrADS version 2.1 and later, there is a new command, set lwid, that allows the user to define a new line thickness setting if the 12 default widths are unsatisfactory. | Suppose you are using the hires data set.
This will result in a map with coastlines and political boundaries, but no US state boundaries: set mpt 2 off
These will plot the coastlines and political boundaries with thick light gray solid lines, and US state boundaries with thinner white dashed lines: set mpt 0 15 1 6
set mpt 1 15 1 6
set mpt 2 1 3 3
'set mpt * 16' |
| set parea | xmin xmax ymin ymax | The command specifies the area for plotting contour plots, maps, or line graphs. This area does not include axis labels, titles, etc., so if you need to see those, provide for an adequate margin. | The region is specified in terms of virtual page units. By default, the virtual page is equal to the real page, so the units are approximately inches on the real page. Maps are scaled to fit within the plotting area such that their correct aspect ratio is maintained. Thus, the map will not fill the entire plotting area except under certain lat/lon ranges. A line graph or a contour plot without a map will be scaled to fit entirely within the specified plotting area. By default, an appropriate plotting area is chosen depending on the type of graphics output. To return to this default, enter: set parea off It is not appropriate to use this command to put multiple plots on one page. It is better to use the set vpage command. | | | 'set parea 9.7 9.9 .3 7.9' |
| set string | color <justification <thickness <rotation>>> | This command sets attributes for strings drawn with the draw string command. | The color argument may be one of the 16 GrADS default colors or a new color defined with set rgb. The justification option controls how the string is positioned with respect to the x and y positions given in the draw string command.
Refer to the diagram below for the valid options. The default justification is bl. tl tc tr tl - top left
+ ------- + ------- + tc - top center
| | tr - top right
| |
| | l - left
+l +c r+ c - center
| | r - right
| |
| | bl - bottom left
+ ------- + ------- + bc - bottom center
bl bc br br - bottom right
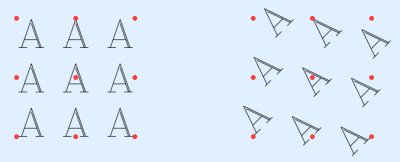
The thickness option must be an integer in the range of 1 to 12 (or 256 for version 2.1 and later.) The rotation option specifies the desired string rotation in degrees. The center of rotation is the justification point. Rotation is counter-clockwise. Defaut rotation is 0. | These two illustrations show how the letter "A" is positioned relative to each justification point; the set on the right has rotation set to 45.
 These settings 'stick' until changed by issuing another set string command, or when a reset or reinit command is issued. When using GrADS version 2.0.2 and earlier, all strings are drawn with Hershey fonts, which are drawn as collections of small line segments. For the X window display and the image output (e.g. PNG), a thickness setting between 1 and 5 will result in line segments approximately one pixel wide; a thickness between 6 and 11 will result in line segments two pixels wide, and a thickness of 12 will give line segments approximately three pixels wide. For the vector graphics output (e.g. PostScript and Encapsulated PostScript) the line segment thickness will increase with each increment in the thickness value. The default line widths for thickness settings between 1 and 12 are: 0.6, 0.8, 1.0, 1.25, 1.5, 1.75, 2.0, 2.2, 2.4, 2.6, 2.8, 3.0. The units (pixels or points) will depend on the surface being drawn to. Strings drawn with Cairo fonts will not be affected by the thickness setting in the set string command. Please read the documentation page on Font Control in GrADS for more information. | If using GrADS version 2.1 and later with the Cairo graphics library enabled, and if using Hershey fonts, then each thickness setting will increment the line segment thickness, for both the X window display and for all hardcopy output formats.In GrADS version 2.1 and later, there is a new command, set lwid, that allows the user to define a new line thickness setting if the 12 default widths are unsatisfactory. | set string 1 tl 1 0
set string 1 c 6 45
|
| set xlab | option | Controls the format of X-axis tick mark labels. | The option argument may be one of the following:- on labeled tick marks are drawn with the default characteristics
- off labeled tick marks are not drawn
- format gives a C-language template for conversion of the label value to a string
| If the X axis represents longitude, then the default behavior is to append an "E" or "W" to all tick mark labels depending on the hemisphere.
Changes to the X-axis tick mark labels are reset by clear, but not display. | | This command would cause all X-axis labels to have 2 digits after the decimal point:
set xlab %.2f |
| set xyrev |
on|off
| Reverses the axes on a plot. | | | | By default for a Z, T plot, the time dimension is plotted horizontally, and the Z dimension is plotted vertically. By setting xyrev, the time dimension would be plotted vertically and the Z dimension would be plotted horizontally. Reset by a clear or set vpage command. |
| set ylint | interval | Specifies the interval between labeled tick marks on the Y-axis. |
- If interval is a positive value, the labeled tick marks will 'start' at 0, regardless of the current dimension environment. For example, if you set the interval to 3, the labeled tick marks will be at 0, 3, 6, 9 ...
- If interval is a negative value, the labeled tick marks will 'start' at the axis start value, which is usually the lower limit of the Y dimension environment. If this were 30 (with an interval of 10), then the labeled tick marks would be at 30, 40, 50, 60...
- This command is overridden by the set ylevs command.
- This command will override the Y-axis tick mark interval specified with the set yaxis command.
- Reset by clear, but not display.
- This command does not apply to a date/time axis.
- set ylint and set xlint may not work as described when used to control grid lines for polar stereographic projections.
| | | 'set ylint 10' |
| set ylab | option | Controls the format of Y-axis tick mark labels. | The option argument may be one of the following:- on labeled tick marks are drawn with default characteristics
- off labeled tick marks are not drawn
- format gives a C-language template for conversion of the label value to a string
| If the Y axis represents latitude, then the default behavior is to label the equator with "EQ" and append either "N" or "S" to all other tick mark labels depending on the hemisphere.
Changes to the Y-axis tick mark labels are reset by clear, but not display. | | This command would cause all Y-axis labels to have 2 digits after the decimal point:
set ylab %.2f |
| set ylpos | offset side | Controls position of y axis labels | - offset offset in inches
- side r or l (right or left)
| | | 'set ylpos 0 r' |